Thursday, 24 April 2014

What to do when you get results that don't make sense

A few different recent conversations and this blogpost on list experiments by Andrew Gelman have made me think about the nature of the file drawer problem.

Gelman quotes Brendan Nyhan
I suspect there’s a significant file drawer problem on list experiments. I have an unpublished one too! They have low power and are highly sensitive to design quirks and respondent compliance as others mentioned. Another problem we found is interpretive. They work best when the social desirability effect is unidirectional. In our case, however, we realized that there was a plausible case that some respondents were overreporting misperceptions as a form of partisan cheerleading and others were underreporting due to social desirability concerns, which could create offsetting effects.

and Lynn Vavreck:
Like the others, we got some strange results that prevented us from writing up the results. Ultimately, I think we both concluded that this was not a method we would use again in the future.
Many of the commenters on the blog said that the failure to publish on these results reflected badly on these researchers and that they should publish these quirky results to complete the scientific record. 

Both of these examples as well as many other stories I've heard make me think that the major causes of the file drawer effect in social science are not null results but inconclusive, messy and questionable results. The key problem is when you get a result from an analysis that makes you reassess some of the measurement assumptions that you were working with. For instance, a secondary correlation with a demographic variable comes out in an unexpected direction or the distribution of the responses is bunched up in 3 places on a 10 point scale.

The problem comes down to this. If I design a survey or other study to test an empirical proposition, the study is likely not to be ideally designed to test the validity of the measures involved and how the design effects are impacting them.

The results you get from a study designed to test an effect are often enough to cast doubt on validity but rarely are enough to demonstrate the lack of validity in a convincing way (i.e. that would be of publishable quality). The outcome is therefore that the paper can either be written up as a poor substantive article (i.e. the validity of the measures is in doubt or a poor methodological article (the evidence about the validity of the measures is weak either way because the study wasn't designed to be a test of the measure's validity).

One answer to this is to do more pre-testing. This can help to establish the validity of measures prior to working with them and can certainly identify the most obvious problems. However, unless the pre-test is nearly as large as the actual sample, the correlations with other variables won't be particularly clear in advance. In addition, pre-testing won't help understand design effects unless it tests different combinations.

However, what is really needed is whole studies devoted to examining design effects experimentally and establishing the measurement attributes. But until that happens for methods such as list experiments, researchers will be stuck with questionably valid results that are hard to publish as good empirical or methodological pieces.

A more radical approach would be to encourage journals of ideas that didn't quite work out. Short research articles that explain why the idea should have worked out nicely but ended up being a damp squib. These would be useful for meta-analysis of why certain techniques are problematic in practice without having the same time requirements for writing up as a full methodological piece.


Wednesday, 12 February 2014

Something every multi-national survey should do


This table is from the Afrobarometer website. You would think that every cross-national survey would have a page like this but I've never managed to track one down on some surveys I'll not mention, while others hide it so effectively it might as well not be there.

Your site can have as much on it as you like but before anything else the following three things should be linked prominently from the front page:

  1. A table like the one above
  2. Links to the original questionnaires for each country
  3. Links to the raw data files, preferably as completely merged as possible


Monday, 3 February 2014

When working in different time zones is a good thing

I've recently been working with a team in a time zone seven hours away from mine. While this type of collaboration can often be a frustrating process of missed meetings and miscommunications, it has actually been surprisingly effective. In fact the vast majority of difficulties we have encountered have occurred due to the lack of being able to hold extended face to face meetings. However, given that everyone involved is spread across four locations this would have not been regular even if we were all in the same time zone.

So why has the time difference worked well in this instance? I think part of the success has been due to the type of work we are doing. We are currently writing a document together that requires revisions and reactions from team members. Generally, reading, commenting on and revising the document takes around three hours.

However, as anyone who has worked with multiple contributors knows, multiple people commenting at  the same time leads to a mess of incompatible suggestions and versions. This means you either have to deal with the mess of reconciling incompatible document versions or wait until each person finishes with their changes before someone else starts.

Being in different time zones actually improves this process because each side of the team tends to wake up to a new draft from the other side without having to spend working time waiting for it to arrive.

The key factor here is that the ideal length of independent work time (on this project) is fairly close in size to the time zone difference. If the ideal independent work time was a lot shorter, then there would be large stretches of underutilised time waiting for the other side to do their work. In this case, being in the same time zone would work much better.

The stretches of projects where long meetings are necessary fit better within a single time zone as they involve a continuous conversation backwards and forwards that gets greatly slowed down if each message has to wait a day for a reply.

Similarly, if the ideal length of independent work time was a lot longer than the time zone difference, then time zone wouldn't matter at all. For instance, the time zone differences between me and the journals I submit to is not at all relevant because the conversation with editors and reviewers tends to take place on the scale of weeks and months.

So what could this anecdote mean for the wider world? Well, it might suggest that we would expect information industries to be spaced around the world according to the size of tasks that are required to be done at each stage of a process. For instance, translation or editing agencies would be well placed several hours away from the sources of demand for these services.  An Indian editing firm might be able to offer overnight editing services for US firms.

I'd be interested to hear if anyone has looked into this more generally or if this mechanism holds outside of the particular case here.


Caveats:
  •  I'm explicitly saying that the success of cross-time zone working is dependent on the type of task being performed and its requirement for parallel versus serial processing. I don't think that time zone differences are preferable in all cases.
  • As usual this is written as a piece of speculation to open a debate and is clearly not a piece of carefully researched academic writing

Friday, 10 January 2014

Is it really that much more expensive to live in London versus Los Angeles?

An interesting project has been popping up on my news feed today. It's a new tool from expatistan comparing the cost of living in different cities (mainly from the perspective of the footloose professional class).

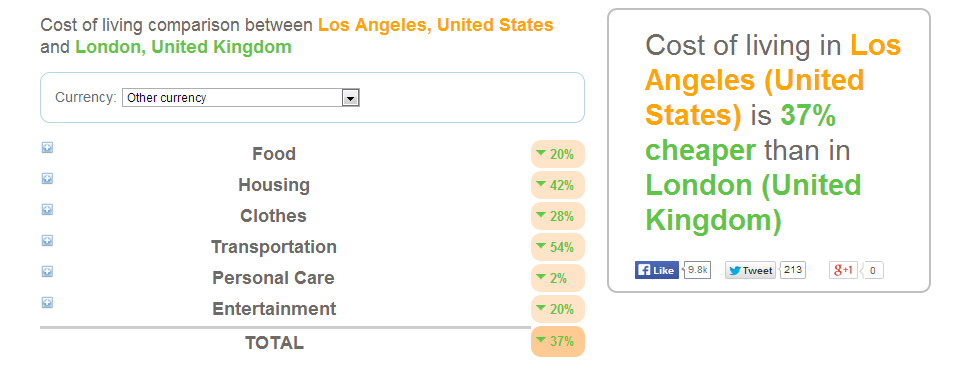
Comparing the two cities I've lived in most recently gave an interesting result:


The site says that it's designed as a tool to help you decide between different job offers around the world. You know your potential salaries and want to know which will give you a better standard of living. 

The standout category in this comparison is transportation with Los Angeles 54% cheaper than London. 

This is calculated by taking the average percentage difference to buy a:
  • Volkswagen Golf 2.0 TDI 140 CV 6 vel. (or equivalent), with no extras, new
  • 1 liter (1/4 gallon) of gas
  • Monthly ticket public transport
  • Taxi trip on a business day, basic tariff, 8 Km. (5 miles)

The car in London is actually 10% cheaper than in Los Angeles. However, London's petrol/gas is 55% more expensive. This is a fair point and reflects the much higher fuel tax in the UK. 

However, the monthly ticket on public transport is where the difference really kicks in. LA's monthly ticket comes out as the equivalent of £41 compared with £127 for London's. 

But that difference isn't the arbitrary choice of Transport for London. It actually represents the best reason to prefer London to LA. In most of London you can take public transport anywhere in fairly little time. Spending £127 means that you don't need to buy a Volkswagen Golf or a liter of gas at all. It's rarely worth owning a car if you live in central London. 

In LA, public transport is simply not a substitute for car ownership. The £41 doesn't pay for anywhere near as much transport in LA. 

And that's not even getting into the largest single expense for many US household: healthcare. 

Saturday, 4 January 2014

Why emotional intelligence leads to poorer job performance: a hypothesis

The Atlantic has an interesting summary of the recent literature focusing on the negative effects of emotional intelligence. Essentially, emotional intelligence not only allows for better interpersonal relations and cooperation but also a greater ability to manipulate others.

One of the most interesting examples that the article gives is that, in non-emotional work (data analysis or car repair rather than counselling or teaching), there is actually a negative correlation between emotional intelligence and job performance (see here for the review article). The Atlantic article proposes that emotional intelligence distracts people from their work in these types of jobs: people spend their time reading their colleagues rather than their spreadsheets.

I have an alternate explanation that should probably be considered. While emotional intelligence may not make you better at low emotion jobs, it probably makes you more likely to be promoted or hired (conditional on prior job performance). If this is the case, then the negative correlation is simply the result of selection into jobs on the basis of emotional intelligence (due to bosses liking the employee or good interview performance).

Essentially a person with low emotional intelligence needs to be better at their job than a person with high emotional intelligence to get hired for the same position. It certainly fits better with my anecdotal observations than people being distracted by their emotions (surely people with more emotional intelligence need to expend less energy on reading those around them).

This hypothesis is also compatible with the finding that emotional intelligence is associated with better job performance in emotional work. In emotional work, emotional intelligence is a good signal for job performance (indeed it may be better than formal indicators), so promoting someone based on it probably improves the job/employee fit.

I've not read the literature in much depth so I'd be interested to hear if this hypothesis has been tested somewhere.


Saturday, 14 December 2013

Making bribe paying legal in India: how can we make it work?

Bribery is a huge problem in many countries. India, the world's largest democracy has a particular problem with this form of corruption. Many studies show that Indians routinely face bribe requests for services they are legally entitled to.

Former chief economic adviser of India and now chief economist of the World Bank, Kaushik Basu, has suggested a radical proposal. Make paying bribes legal, while maintaining the illegality of requesting bribes.

He argues that criminalizing both sides of the transaction aligns the interests of the corrupt official and bribe payer. Neither one wants to report the transaction because they would both suffer. In fact Basu goes further and suggests returning the bribe to the bribe payer in the event that they report that the bribe took place.

This final detail is important for incentivizing bribe givers to go to the trouble of reporting the bribe takers. However, as Basu notes, it does create a new set of incentives to falsely report bribes and this could just create a whole new problem of public official harassment and a court system too overloaded to actually deal with the real claims of bribery.

I think there might be a potential fix to this proposal that would get round these problems. The answer is that we don't return the bribes but we do make not reporting a bribe an illegal act. In this way we create the heavily divergent interests between bribe payer and bribe taker but don't create the perverse incentive to falsely report bribes.

The power of the "duty to report" law will depend partially on the likelihood of being caught. To increase this probability I would suggest running a small number of high publicised sting operations where well audited and video recorded officials request bribes from the public. These bribes are returned in full with a reward in the event of the person reporting the mock bribe and the person is prosecuted if they fail to report it.

The fear that a bribe requester could be a sting operation will heavily skew incentives to report any bribe requesters in fear of being prosecuted if you do not do so.

See here for the Planet Money write up
http://www.npr.org/blogs/money/2011/04/01/135011027/why-paying-bribes-should-be-legal

and here for Kaushik Basu's paper
http://finmin.nic.in/workingpaper/act_giving_bribe_legal.pdf

Wednesday, 4 September 2013

An idea for a more useful Google Trends

I've written a couple of articles (the second one is coming out in JEPOP some time soon but I don't have a link yet) about the limitations of using Google Trends data for social science research. The major issue is that many more search terms seem like plausible measures than actually turn out to correlate with public opinion. Search terms don't even necessarily work across different countries that speak the same language!

As a result, any use of these trends has to go through the process of matching up the data to equivalent survey data before it can be used validly.

But what if we didn't have to do all that?

One of the reasons I suspect the Google Trends sometimes don't match up as well as we would hope is that it counts searches not people. A handful of furiously searching journalists and politicos can drive the trend as much as widespread searching across the population. This means that issues may be ignored by 99% of the population but still result in a lot of Google searching.

So the graph above tracks what percentage of all searches in the United States were for the term "Syria" on different dates (these percentages are then scaled to a 1 to 100 index so we don't know the actual percentages).

This representative problem is easily solvable for Google. Simply report the trends for number of people searching for a term instead of the number of searches for a term. Google could simply offer us the option of tracking the percentage of people using Google on each date who searched for the term "Syria". Even if journalists search for Syria a thousand times, it will only count as one person.

It's not hard for Google to identify different people either. While there are some complexities to tracking an individual over time, Google has been building profiles on its users for a long time and even a measure of the number of unique IPs that searched for a term would go a long way towards solving this problem.

Having both of these settings as an option would give much greater insight into the breadth and depth of opinion on an issue.

It might even make offhand references to Google Trends as a proxy for public opinion a little more accurate.

Note: There are other reasons why Google Trends data might not match up to public opinion (see the papers) but this is certainly one major concern.


Thursday, 29 August 2013

Would changing law school to two years reduce tuition fees?

Barack Obama's recent comments on reducing law school length to two years have prompted discussion about the trade off between reducing costs for students and the quality of legal education.

However, there's a fairly major point being overlooked, that reducing the course to two years is unlikely to reduce the upfront cost of legal education to students.

Let's assume that Obama is right and law school can be shrunk to two years without reducing quality. Given the huge variation in legal training in different countries, this seems reasonably plausible. We'll make a second assumption that law firms will recognize this fact at least over the medium term.

If this is the case, then the opportunity cost of taking a three year law course is a year of earnings and the interest accrued on loans over the extra year. By this logic, the two year course actually has higher expected value than the three year course and so students should be willing to pay more for a two year course than for a three year one. Because there is no regulation of tuition costs, law schools will quickly adjust prices to fit the demand for the shorter programs.

The key point is that a yearly tuition fee is best understood as a payment plan towards the whole cost of a degree, than a price for each year.

One point that is worth considering is whether fees might be reduced because of lower costs to the law schools of holding the courses. This is possible, but probably only if the market as a whole shifts in that direction so that all law schools are competing on the basis of two year costs. In a mixed market it probably makes sense for two year courses to maintain prices: 1) because they can and 2) to avoid signalling a lower quality product.

So if upfront costs are unlikely to go down, is the plan a bad idea? Not at all. The reason prices won't go down is because two year courses offer a better deal for the student. A chance to be a lawyer a year earlier and an extra year of earnings over a career.

This last point is also important for society. A student who enters the jobs market a year earlier provides an extra year of lawyer. And this difference isn't an extra year of a junior lawyer but an extra year of being an experienced lawyer at the end of the career. The lawyer becomes a lawyer "with 30 years of legal experience" a year earlier and a lawyer "with 40 years of legal experience" a year earlier.

So reducing law school length sounds like a good option, just don't expect it to reduce fees.

Tuesday, 27 August 2013

Could the pope make everyone in the world a European citizen?

The Vatican occupies an interesting place in international law with certain functions of its government assumed by Italy but with independence in other respects. While reading around this, I noticed an oddity that might allow a pope to grant Italian citizenship (and hence European citizenship) on as many people as he wishes.

This stems from the Lateran treaty that setup the legal relationship between Italy and the Vatican. Certain employees of the Vatican are made citizens of Vatican state for the period of their employment. However, this citizenship is removed once their term ends. The Lateran treaty refers specifically to this group as follows:

"Ceasing to be subject to the sovereignty of the Holy See, the people mentioned in the preceding paragraph may, if in terms of Italian law, regardless of the circumstances of fact set forth above, are not considered to be equipped with other citizenship, will be regarded in Italy as citizens certainly Italian." (Google translated)

Essentially, former citizens of the Vatican who no longer have any other citizenship are automatically granted Italian citizenship instead of being made stateless. This opens up the tantalizing possibility of the pope hiring large numbers of temporary staff for 2 days. Then, once they have renounced their previous citizenship- firing them- making them automatic Italian citizens. This logic suggests that the Pope can essentially create as many Italian (and therefore European) citizens as he wishes.

However, what would happen next is more murky. Since Italy hasn't signed the Convention on the Reduction of Statelessness, which generally disallows the removal of citizenship  when it would leave an individual stateless, they might just pass a law revoking post-Vatican citizenships. I'm not a legal expert so I'm unsure whether this counts as breaking the Lateran Treaty. EU law might also have some sway but it generally defers to Member States on their right to determine rules around citizenship.

Given the new pope's greater focus on poverty, perhaps opening up Europe's borders will appeal as a poverty reduction measure.

Notes:
1) I certainly don't think Francis will do this and the effects of it would likely be very uncertain.
2) This is basically a "real life" version of the ploy from Elysium to get everyone in the world healthcare.


Thursday, 1 August 2013

Automatically creating citations for your R packages within knitr

Health warning: the following post is about solving a fairly small problem when using R, latex and knitr. If you don't already use two out of three of these you might want to skip over this post!

Workflow issues are some of the most irritating issues in academia. On one extreme you can use stata and Microsoft word to analyse and write your documents. However, there are a whole host of formatting and replicability issues that go along with this setup. At the other extreme you can use an ever increasing cocktail of software to finely hone every aspect of creating a paper with the consequent problems of updates, conflicts and looking for missing parentheses in five different scripts.


Tuesday, 23 July 2013

Is the US airbase in Kyrgyzstan completely empty?

Brief background first. Kyrgyzstan is currently the only country in the world to host both a Russian Airbase and a US Airbase: the Manas Transit center.  Manas is the main air route that the US uses to fly personnel and equipment in and out of Afghanistan. The Kyrgyzstan government has threatened to close the base several times, sometimes coinciding with newly generous aid packages from Russia. At present the US government has been given until June 2013 to close the base.

But putting aside the exciting story of Russian and US meddling in Central Asia, I have a much more mundane question. How come the US Department of Defense generally reports that it only has between 5 and 20 personnel present in Kyrgyzstan in its official statistics for each month between 2001 and the present? I'm not a military expert but I would have thought that it took more than  20 people to run an airbase that is reported to move up to 50,000 US and coalition troops to and from Afghanistan each month. Incidentally an ABC news report mentions that Manas is staffed by 1,200 people.

I came across this issue when checking the Heritage Foundation's compilation of the American troop deployment data.  Their data does seem to match the DoD's figures but I'd like to know whether these numbers have any validity or if the Kyrgyzstan data is a single oddity in an otherwise high quality dataset.

I'm interested in hearing if anyone has an explanation. Is there a counting technicality that makes the staff on base not technically active duty? Is the US downplaying its presence in Kyrgyzstan in its military statistics to try and avoid creating local tensions? Is the Manas airbase staffed by mercenaries or ghosts?

Sidenote: this was the first figure in the dataset that I checked because I've been following the disputes over the airbase for a while and wanted to see how large a force was deployed there.

The heritage data has also been used in a couple of academic articles so this is an issue that affects things other than my own research.

Monday, 6 May 2013

The Local Elections in Graphs

After recovering from the all night election analysis at the BBC, I've put together some graphs that show some of the key results in the key wards we cover.

Some topline results

The following graphs show some of the interesting results we saw across the key wards. The first thing to realize about these elections is that they were in very Conservative leaning areas. Even after the UKIP surge, the mean ward result in our dataset looked like this:


Nonetheless, the UKIP share is an incredible performance for a small party. But the picture is very different when we look at the ward distribution. The ward results look surprisingly similar to the status quo with the tories capturing more than half the wards. 

In particular, UKIP goes from second in vote share to fourth in seats. As Steve Fisher, another BBC psephologist and lecturer at Trinity College Oxford, argues, this discrepancy is largely the result of UKIP's vote distribution. The violin plot below shows the vote distribution for each party i.e. how many wards each party got a given percentage of the vote in. If we look at the Liberal Democrats and Labour, they show a highly skewed distribution: they get very low shares in a high proportion of wards with a long tail of better performances where they manage to get seats. By contrast, the UKIP vote is close to normally distributed with little skew. 


The point is inadvertently put best by the UKIP Mayor of Ramsey who tweeted:
The distribution of UKIP's vote ensures that they receive a very high number of second place results.

It's not only the vote distributions that cause problems for UKIP. It's also the distribution of their vote changes. The following graph shows the distribution of the vote changes for each party since the 2009 elections. Given that the three major parties each started from a more efficient baseline (in terms of votes to seats) than UKIP, UKIP would ideally want to have a more skewed set of changes. However, we see exactly the opposite. Labour made 209 gains from a 7.9 percentage point increase compared with UKIP gaining 118 seats from an 11 percentage point gain. This is at least partially because of it's skewed vote increases. Labour has a long tail of increases which, along with its initially skewed performance, led to its strong ward performance.

Thanks to Steve Fisher, John Curtice and Rob Ford for their work on the results and the whole BBC elections team. Note: this post does not reflect the views of the BBC.


How the BBC elections work

Some background. The BBC monitors the results in a set of councils intended to be representative of the election as a whole. In this election they monitored 21 of the 35 councils. With people posted in each area to phone in the results as they happened. This allowed us (the psephologists) to get an up to the minute picture of the election as it happened (mostly at 2am when there was no election programme on air). We collect a variety of demographic and political information about all of the key wards covered and we use this to help inform the viewers about what the results mean, particularly through John Curtice's analysis.


Friday, 3 May 2013

Will general election turnout stop UKIP repeating their performance?

UKIP's record breaking performance has the world (or that subset of it that follows English local elections closely) talking about whether they might repeat this performance at the general election. If they did, then they might replace the Liberal Democrats as the third party in the House of Commons.

Before getting carried away with speculation on Nigel Farage's role in a future coalition government, it is worth considering some factors that might limit this. One factor is the odd electorate that votes in local elections. While the BBC's projected national share accounts for the difference in the areas that vote, it doesn't account for the difference in the electorate that turns out. These differences can be large, just 31% of eligible voters made it to polling stations yesterday compared to the 65% who voted on election day.

These differences aren't random either. In particular, local elections voters are much older  those at general elections (broadly, the elderly will turnout in every election whereas the young tend to only show up for high profile contests). Conservatives and liberal democrats have been the traditional beneficiaries of this differential turnout but UKIP has a strong base of support among the elderly.

So what would these results have looked like if the turnout had been 65% rather than 31%. To give a rough answer to this question I looked at how much share UKIP gained since 2005 (a general election) in each ward depending on how turnout changed between the 2005 General Election and 2013's local contests.


UKIP vote change 05-13
Turnout change 05-13
-0.065

(2.42)*
_cons
17.810

(15.14)**
R2
0.03
N
163
* p<0.05; ** p<0.01


As expected, UKIP improved their performance more in contests that saw a sharper drop in midterm turnout. However, this would not have been sufficient to dent their performance greatly: they would lose a total of 2 percentage points bringing them from a 23 point PNS to a 21 point result.

While UKIP benefited from low turnout, it is not enough to begin to explain their huge electoral gains. It will take more than robust turnout to reverse their success in these elections.


Note: These results are also robust to a set of controls:


UKIP vote change 05-13
Turnout 05-13
-0.061

(2.25)*
Population Density
-0.015

(0.29)
% aged 65+
0.293

(2.05)*
% white
-0.156

(0.67)
% aged 18-24
-0.193

(1.27)
_cons
28.916

(1.31)
R2
0.10
N
160
p<0.05; ** p<0.01


Caveats:

  • See previous post
  • I realise I'm in danger of contributing to the "questions to which the answer is no" genre of blog writing. In my defense I didn't know that the answer would definitely be no in advance. 


Blown away: How much impact did wind farms have on the UKIP vote?

UKIP's rapid rise has led to certain gaps in their policy platform. The party's core issues of immigration and Europe have been fully articulated but the rest of the platform is still in a state of flux. Another line of policy has been to take up various "NIMBY" (not in my back yard) issues. For instance, their Yorkshire and Lincolnshire webpage gives high prominence to the wind farms. In fact it's the only policy area mentioned on the site other than Europe.

So what should we make of this NIMBY focus? Is it a key part of their appeal or just window dressing around their core anti-immigration/EU message? 

Taking a first look at this, I've compared the UKIP performance in wards where there is a wind farm to those without one. I was helped in this by a wikipedia article listing the coordinates of all onshore wind farms in the UK (I am very intrigued about who put this together) and the ever useful mapit API. 

For now I'm simply analysing the difference across the BBC's keywards (those councils that they analyse in detail) that have declared results  (as of 3.31pm 3/5/2013), so these results are very preliminary. Among these wards, 19 have wind farms and 14 of these have UKIP candidates standing.

In these 14 wards UKIP averaged 32.7% of the vote, this compares with a share elsewhere of 24.6% (n = 1170). If this is robust (a big if), it would make the presence of wind farms one of the biggest effect on UKIP share.

Of course, it may simply be that UKIP does well in rural areas, which also tend to be the ones containing wind farms. 

A quick regression analysis suggests that this isn't the case. Although the difference is not quite as large as the raw figures, they still perform 6 percentage points better in wards with wind farms that those without. 


UKIP 2013 share
Population density
-0.054

(3.49)**
Wind Farm
6.160

(2.86)**
_cons
25.689

(73.17)**
R2
0.02
N
1,083
* p<0.05; ** p<0.01

So the analysis so far suggests that NIMBY issues may have some potential for UKIP. 

But wind farms are only relevant to a small number of wards. A second NIMBY issue that might have more wider relevance is High Speed 2. The proposed route of the train line cuts through many councils being counted today. UKIP have been slower to jump on this issue, but we can look at whether it's helped their vote. The potentially affected postcodes are listed by safe-move.co.uk and were coded up using mapit.

Unlike their wind farm success, the regression suggests that there is little difference in UKIP performance in wards affected by HS2.


UKIP 2013 share
Population density
-0.051

(1.94)
HS2
-2.919

(0.81)
_cons
11.580

(18.25)**
R2
0.02
N
291
* p<0.05; ** p<0.01

So far then, UKIP's share does not appear to have been driven primarily by NIMBY issues. Their possible success in mobilizing support around wind farms has not been replicated for HS2, which is potentially much more widely relevant. 

The lack of an effect of HS2 might be seen as a missed opportunity for UKIP. However, it also underscores a positive result for them: their strong showing is not merely the result of canny use of local issues but a genuine national shift in their favour. 


Caveats:
  • These are obviously preliminary results and there may be other factors to control for. I hope to analyse some of these in future posts.
  • The worst affected HS2 postcodes are in Buckinghamshire which the BBC is not covering due to large boundary changes. 
  • It is questionable whether these effects should be seen at ward level or perhaps at district level. I'll look at this question in more detail later.
  • Obviously correlation =/= causation.
  • Ideally, I would show the regression for the changes in the shares since 2009 and 2005 but UKIP has fielded candidates in so many new locations, that there simply aren't enough results for comparison.
  • This blogpost does not reflect the opinion of the BBC or my department. 


Friday, 26 April 2013

Why predicting stock markets from Google Trends could be bad news for science.

A new study from Tobias Preis at the Warwick Busines School appears to show that Google Trends data can predict falls in stock prices. The theory is that investors search for information about stocks they are thinking about divesting before doing so.  

While I've been sceptical about some uses of Google Trends data in the past (see here and here for details), the latest study has a solid theoretical mechanism and strong data analysis to support it.

So why am I unhappy to see this study?

Well, the publication of this article guarantees one thing about the future. There will be bots using Google Trends as part of their trading strategy. And if people are using this trading strategy, then there is an incentive for others to manipulate the Google Trends data to try and exploit this strategy. 

The number of searches required to shift Google Trends is reasonably high but not at all out of the question for someone with access to a botnet (and there are a lot of people with access to botnets). We could even see a new high frequency trading style battle between different trading and searching algorithms each trying to fool the other about their intentions.

Now, people will probably argue that the botnet response will remove the profit in the Google Trends trading strategy. This may be true, but the reported 326% over 7 years return suggests significant room for reducing the signal of Google Trends before it becomes unprofitable to trade off it.  

However, even if Google Trends still returns sufficient information that it can be used as part of a trading strategy, the results may have devestating externalities for other users of Google Trends data. While there has been a great deal of hyperbole around Google Trends, there have been successful uses of it for measuring different variables from flu outbreaks, to economic trends, to issue attention. The usefulness for these applications may be casualties in the race to make Google data only marginally profitable for trading. 

So I'm happy to see new uses of these data but I worry that a profit incentive may ultimately make them entirely worthless. Here's hoping to be wrong. 

Wednesday, 16 January 2013

Zombie nation? (an update on a sleepless world)

Sadly this isn't a post about German trance band made famous by this piece of popular music (slightly NSFW) but a follow up to my previous post about sleep reduction and the economy. It stirred up plenty of debate here and at Marginal Revolution and EconLog so I thought I'd follow up with some amendments and replies. Thanks to everyone who linked and commented- working through a new idea like this is exactly what I hoped the blog would allow.

Is 2.5 hours realistic?

Plenty of responses were sceptical whether modafinil could reduce sleep to 2.5 hours a night regularly. This is a fair point and the figure is definitely toward the extreme end of reported experiences on the Internet and most of these were not long term users. I used the 2.5 hours as an extreme case (which it's fair to say is probably not achievable for most people with current medicine) but the more common experiences seem to be people who reduce their sleep by a few hours habitually and people who use the drugs to stay up for extended periods once in a while without suffering the drastic cognitive declines insomnia normally entails. It'd probably be possible to keep people up for this long but I'll agree with the commenters that this is likely unsafe. So current drugs such as Modafinil are probably not capable of changing a whole population over to a 2.5 hour sleep schedule, so we would probably be looking at smaller increases in the work day than the 34% discussed. Still, the mechanisms of increased productivity should still apply albeit at a smaller magnitude.

40 hour weeks are as much as we can do

Other commenters suggested that a 40 hour work week is the maximum productive number of hours people could manage. This may be true at present but most of the studies on these drugs do suggest they have a substantial impact on reducing fatigue and maintaining performance. I'd see this 40 hour limit as a contingent fact of our normal mental state rather than a cast iron rule. These drugs are doing more than keeping users awake in an undead state but actually prolonging the time that they are able to be alert.

An arguably stronger effect of this class of drugs would be increasing the productivity of those already working long hours. The current usage of these drugs seem to support this view. A study of doctors found that their performance during long shifts was significantly improved by taking modafinil. The authors conclude that:

 Our results suggest that fatigued doctors might benefit from pharmacological enhancement in situations that require efficient information processing, flexible thinking, and decision making under time pressure. However, no improvement is likely to be seen in the performance of basic procedural tasks.

Sleep is important

At the moment this is definitely true and there is convincing evidence that sleep promotes memory consolidation. What we don't seem to know (it'd be good to hear from any sleep experts who have a more complete answer) is how much sleep is required and whether these functions are affected (positively or negatively) by wakefulness drugs.

People enjoy sleep

I am genuinely not sure if this is true. I certainly enjoy dreaming (which is only a small proportion of total sleep), snoozing (that half asleep phase after you wake up) and feeling refreshed. But I'm not sure I like sleeping 8 hours simply because it meant I was asleep for 8 hours. If I could feel equally refreshed and remember just as many dreams after 3 hours I'd probably be just as satisfied. I'm not sure if the number of hours in which I was not experiencing anything is something I value in itself so much as for the effects it has on me.

I don't want to work more hours

This was probably the most commonly made point. Whether this is valid comes down to whether we care about the proportion of our time that we are at work or the total amount of work we do in a day. The American Time Use Survey in the previous post suggests that (at least on work days) people spend more of their waking hours working than all other activities combined (this includes household tasks and caring for dependents). If we do get extra wakeful time it could all go to leisure but this would be a huge increase in the proportion of our waking lives spent in leisure. This of course is no bad thing but our current tendency spend a high proportion of our time on work suggests that people do not value leisure so much as to forgo wages substantially.

The split I suggested would increase leisure time much more proportionally than it would work time. Nevertheless, it is an open question whether we fundamentally dislike working more than 8 hours a day regardless of the time we spend in leisure. It is possible that regularly working 11 hour days would be unpleasant regardless of how much leisure time was available for relaxing. There may be timetable that can allow extended breaks of several hours during the day but everyone knows lunch breaks don't feel as good as real time off.


Signalling?

Nelly wrote that:
"These drugs may make someone more productive on a daily basis, but wouldn't necessarily make someone more productive on an hourly basis. Maybe more importantly, it is quite possible that those who would choose to take these drugs would be negatively selected. They would likely be taking them to become more competitive, which would be in line with your increasing the labor supply argument."


This is an interesting point and might be true to begin with. However, if the negative selected individuals are managing to compete with those with a higher underlying skill, it might make sense for skilled people to take these drugs as well in order to maintain their position. In a jobs market where the payoff to human capital is partially positional (i.e. almost every jobs market), people with higher talent are disadvantaged by people with lower talent using drugs to catch up. If the talented can't stop the dopers from using drugs, then they may be pushed towards joining them.

This creeping economic pressure to use these drugs is still the most convincing argument against their use. But this is roughly analogous to the economic pressures to use any other technology. Workers who refuse to use any motorized transport limit their job opportunities and only a few farmers still use pre-industrial methods. That's not to say that cars and fertilizer are purely positive developments but they still spread rapidly.

These pressures mean that if we do decide that we don't want to live in a society that relies on these drugs, we may have to actively regulate them rather than leaving the decision to individuals.

Sunday, 13 January 2013

The Sleepless World: One more piece of low hanging fruit?

Update: more detail on the argument and responses to it here and minor edits in this post

Tyler Cowen at Marginal Revolution is a major proponent of the Great Stagnation thesis: that new innovations are not having the same impact on productivity as those we saw in the previous 150 years. Think of iPads versus electricity and cloud computing versus the railroad. Hence, we can expect to see slowing growth in GDP per capita as future productivity gains will take much more effort to unlock. This week The Economist took up this line of thought with a thorough briefing on the subject that broadly agreed with Cowen, although with some equivocation.

Overall, I think the argument has a lot of merit but there may be at least one more piece of low hanging fruit: a vast reduction in our need for sleep.


The American Time Use survey reports that an average American work day includes 8.8 hours of work and 7.6 hours of sleep. Sleep is the second largest single use of time. However, new drugs such as Modafinil appear to vastly reduce the need for sleep without significant side effects (at least so far). Based on anecdotal reports from users, it seems that people could realistically [edit: potentially (see update)] cut their sleep requirements to as few as 2.5 hours a night without a decrease in mental acuity. That gives us another 5 hours to distribute over the day.

Workers would probably prefer to allocate the bulk of that extra time to leisure but I doubt employers will let that happen. Let's make a generous breakdown and give work an extra 3 hours and let workers spend another 2 as they wish. This increases working hours by around 34% and potentially increases leisure time by 80%. This increases the number of hours a worker spends at work from around 1800 hours a year now to about 2,400.

So would this lead to an increase in productivity? That partially depends on how we measure it. If we look at output per worker, then a 34% increase in hours worked would be a substantial boost in productivity and would surely lead to increased economic growth. This alone makes a sleepless world a classic example of low hanging fruit (although it may be closer to an increase in labour force participation than a productivity boost from innovation).

However, there are also reasons to think that output per worker hour may be improved by longer hours. Let's assume that the additional hours worked allow companies to keep the same production with a quarter fewer workers.  Why hire four workers for a task, when you can hire the three workers who are most productive to do more hours?

That process would be a major gain for firms. They can hugely reduce costs by spreading the fixed cost per worker over more hours of work. More hours worked shouldn't increase costs of healthcare, training and fringe benefits so the fixed costs fall in line with their reduced workforce.

There are also productivity boosts by lengthening the work day itself in terms of travel time, starting up computers and lunch breaks that we wouldn't expect to increase at the same rate as hours worked. The longer work day may also push forward globalization as workdays overlap for longer periods across time-zones.

Once again though, the gains go even deeper than this. Probably the largest productivity improvement  of all will be in human capital accumulation and the returns an individual can expect from it. From the perspective of a student, a sleepless world is an increase of a third in expected working lifespan giving a longer time period for her to benefit from the investment she has made in her human capital. It also means she can potentially finish her education in a shorter time or use the additional waking hours in employment, reducing the opportunity cost of an extended university education.

The sleepless world may finally begin to reverse the age inequality in employment (at least temporarily). Young people will accumulate job experience at a faster rate through more hours of work experience. They may also be more willing to adopt the new drugs than older generations increasing their relative value as employees.

So given the benefits, do we want to grab this piece of low hanging fruit?

The main argument against it is that it will not be a voluntary choice for an individual. If these drugs become widely available then workers who are willing to use them will easily out-compete those who do not. In addition, if the drugs are expensive then it will further increase inequality between those who can afford them and those for whom the price is prohibitive. However, a Google search of various dubious websites suggest the current drugs retail for around $5 a day. At that price, even those working at minimum wage would find it worthwhile to buy the pills.

The final argument against is that a rapid introduction of these pills would amount to an increase in the labour supply and cause a fall in hourly wages or unemployment. However, it's likely that individuals would generally still see an increase in their overall income and their additional leisure time (2 hours extra) would allow this to be translated into an increase in demand in the economy through increased consumption.

Overall the transition to a sleepless world seems beneficial to humanity. There's nothing special about the 7 hours of sleep we get right now and I think people would rightly be opposed to a change that made everyone spend an extra hour asleep every day.

Caveats:
  • I've never used Modafinil. This is because I don't know where to buy it, I have some moral qualms about using it when the rest of the world is not and because it is still a bit early to conclude that there are no long term health effects;
  • Some people I've talked to have raised the issue of environmental damage. I think the total environmental impact of a sleepless world could be positive or negative but surely the damage would be lower per unit of output (because there are a lot of fixed carbon outputs per work day such as commuting and building overheads). At the very least, a sleepless world looks like a more environmentally friendly growth strategy;
  • This argument is premised on the safety of these drugs. Clearly the calculus will change if they are shown to have negative long term consequences;
  • For those people who already work long hours with little sleep, these drugs should at least make that lifestyle less dangerous. There is convincing evidence that chronic lack of sleep is harmful in normal circumstances;
  • The precise amount of sleep that a Modafinil user can get by with seems to vary but all sources I've seen suggest it is dramatically lower;
  • The short term costs of a rapid change might be substantial so gradual adoption is probably preferable from the standpoint of welfare.

Sunday, 30 December 2012

Making maths easier to follow in sociology

One issue I have when I read a maths-heavy social science paper is that it's difficult to skim through them. Some people might think this is because they are denser and more complex. This is certainly true in some cases but I don't think that's actually the main issue. The key requirement for skimming is that you can start reading the text at any point. If I'm familiar with a topic I can usually jump into an interesting looking patch of text in a paper and go from there. It's good to have the additional definitions and background at the start of the piece for those who are new to the area but it can be safely skipped by anyone already aware of the issues.

Unfortunately this is rarely possible with maths as the symbols used are defined throughout the piece, so any skimming soon requires flicking back through the article to find the definition of each symbol. Some notation is used consistently enough for its meaning to be inferred from context but its pretty rare and the point of using mathematical notation is not to create a system of hieroglyphs that each cover a unique concept. What this inevitably means is that I have to start at the very beginning of a paper and work through in order to make sure I don't miss any definitions. I've read econometrics textbooks that use notation they defined three chapters earlier!

I think there might be a better way to do this.

What if every mathematical symbol in a paper could have its definition brought up by rolling the mouse over it or clicking on it.

I envision a latex package for it working something like the following:

\definemathsymbols{i}{An individual survey respondent.}
\definemathsymbols{\epsilon_{uik}}{The uniform component of measurement error.}

Any subsequent use of the symbol would insert the mouseover text on the right so that a reader who is skimming can easily find out what your idiosyncratic notation means.

Then if you wanted to redefine a symbol you would just use the command again:

\definemathsymbols{i}{The currently selected ego in the simulation.}

These definitions are not designed to give a complete understanding of what's being done in the paper but they should allow a casual reader to skim a few equations and work out whether it's worth diving deeper into.

Not sure of the technical difficulties in implementing this but I think it could make a reader's job much easier.

If anyone wants to collaborate on writing a package or pointing in the direction of an existing one I'd be interested to hear from you.

Thursday, 1 November 2012

How an Obama Victory Could End the Electoral College

By most measures the popular vote for the presidential election is  almost tied (with perhaps a slight edge for Obama). Nonetheless, electoral college predictions, such as FiveThirtyEight, give Barack Obama a high probability of retaining the White House due to a lead in swing states, particularly Ohio.

This means there's a non-trivial possibility that we'll see the reverse situation of Al Gore's 2000 loss of the electoral college, even while winning nearly half a million more votes than George W. Bush. This year, Obama could well win Ohio, and therefore the electoral college, while gaining the support of fewer Americans than Mitt Romney.

If this does happen, it raises interesting prospects for constitutional reform. Despite strong public support, it's very unlikely that electoral college reform would passas a constitutional amendment - with a two-thirds majority support through both houses of Congress and then the support of three-fourths of the States required to ratify it. But it could put new momentum into a quieter approach to electoral college reform that has been slowly making progress -the National Popular Vote Interstate Compact (NPVIC).

This approach to reform takes advantage of the constitutional clause allowing states to appoint electors in the manner of their choosing. The NPVIC approach is to make states pass laws to give all their electoral college votes to the winner of the national popular vote, but this only goes into effect if states with a combined 270 electoral college votes – the number of electoral votes required to win the presidency - also pass laws promising to do so. This would guarantee that the popular vote would always determine the presidency. 

So why might we expect an Obama win to push the NPVIC plan over the 270 threshold? It turns out that states making up 132 electoral votes have already passed the bill: Maryland, New Jersey, Illinois, Hawaii, Washington, District of Columbia, Vermont, Massachusetts and California. The first thing that's obvious about this list is that it's heavily skewed towards Democratic states still smarting from Gore's 2000 defeat.

But if Obama wins it's not Democrats but Republicans who will be decrying the illegitimacy of the president (as they sometimes do already), and passing the NPVIC might seem the perfect way to push that agenda.

So if Obama wins, which states might be most likely to pass the NPVIC? At the moment the electoral college rewards several things:

Small States: the extra two electoral college votes that each states receives due to its Senate delegation go a long way for small populations. Wyoming has just 0.2% of the US population but 0.6% of its electoral college votes. This bias leads candidates to campaign more heavily in small rural states than would make sense tootherwise.

Swing States: the other major beneficiaries of the current system are swing states. If a state could plausibly swing to either party there's a very good chance that the candidates will find lots of enticing things to offer its voters.

With that in mind, the likeliest candidates for passing the NPVIC would be large Republican states. Perhaps Texas (38), Georgia (16), Tennessee (11), Arizona (11), South Carolina (9), Alabama (9), Louisiana (8) and Kentucky (8). In total that gives us an extra 110 electoral votes bringing us to 242 total. Close, but still 28 votes short of the magic 270 required to pass the proposal.

From here we'll either need a lot more small Republican states or one or two additional large states.

For the small states approach we would need to convince Oklahoma (7) Mississippi (6), Arkansas (6), Kansas (6) and Nebraska (5) for an extra 30 votes pushing us to 272. But some of these would probably be reluctant to undermine the attention paid to rural states by candidates.

Florida or New York alone would be sufficient. But New York is heavily Democratic and unlikely to want to undermine Obama at the start of his second term. Florida meanwhile might be reluctant to give up the political attention that comes with its decisive role in presidential elections.  Outside of these, two states would be needed to seal the deal. One of these might be North Carolina. While it went for Obama in 2008, it has looked solidly Republican throughout this electoral cycle and is controlled by Republicans at the state level. With North Carolina's 15 electoral votes, it would then only take a few more votes to push the NPVIC reform through.

So the NPVIC might just become viable if Obama wins a second term despite a loss in the popular vote. But even with support from large Republican states, NPVIC reform will still require some help from the beneficiaries of the current system.

Given the huge impact of the electoral college on American history, a change in this system could end up being the biggest legacy of Obama's second term.